Appearance
📊 Dashboard Overview
What is the Dashboard?
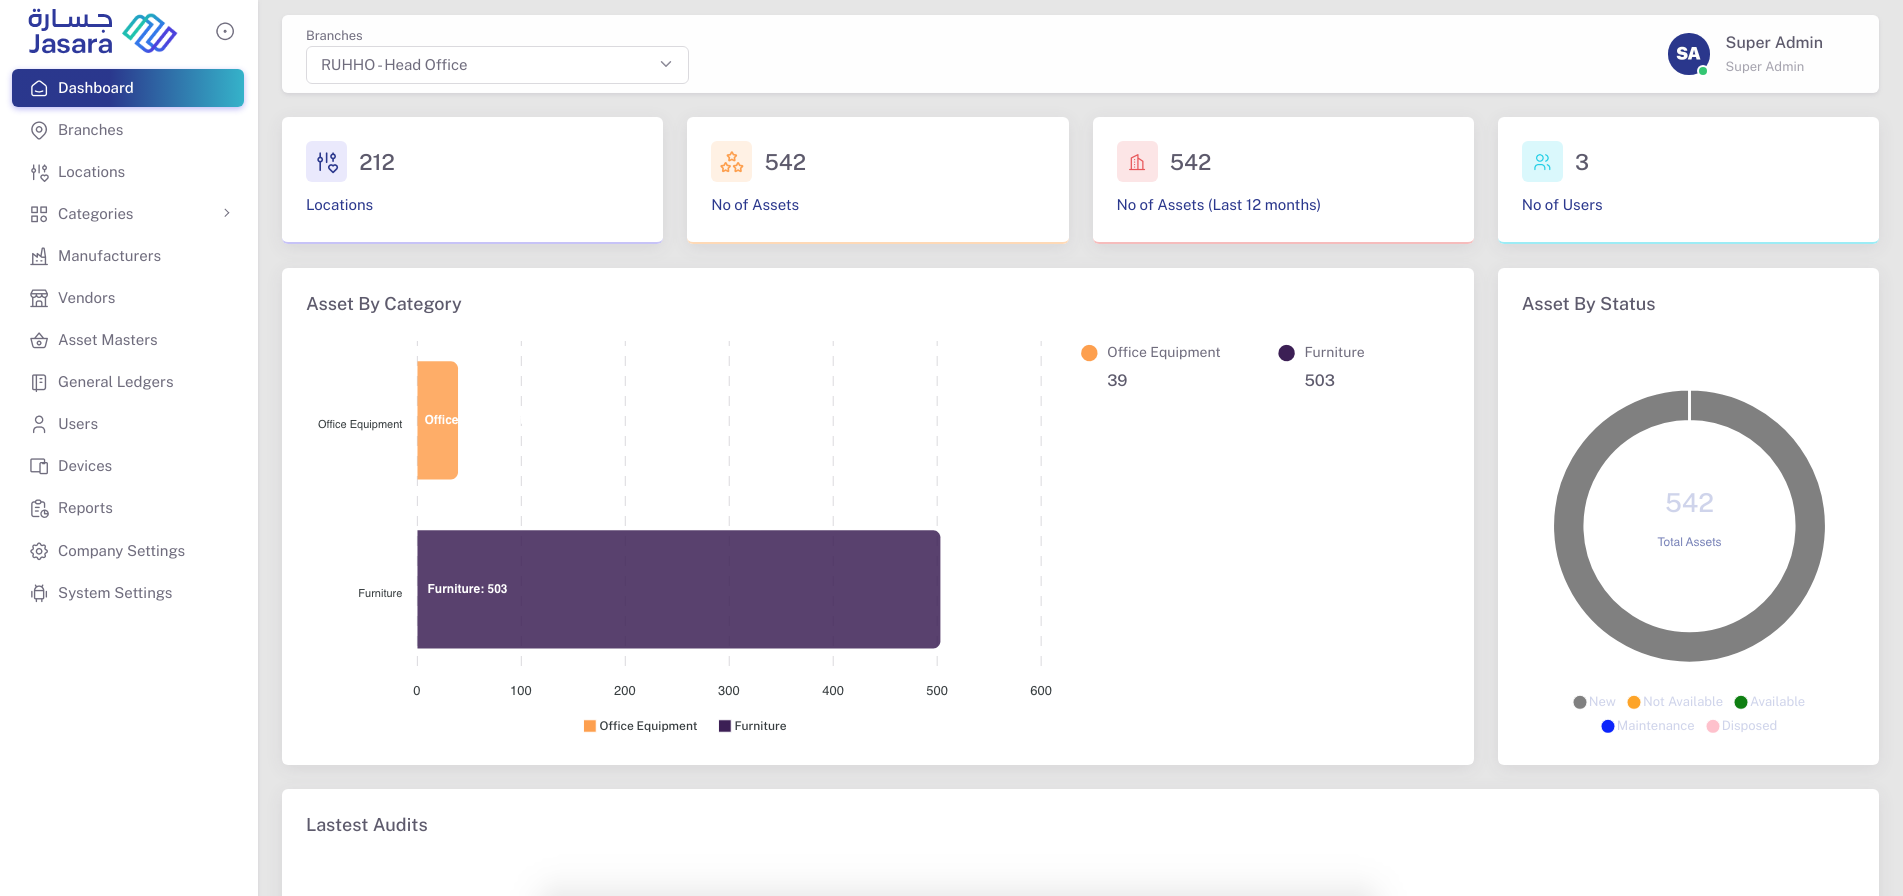
The Dashboard is the first screen you see after a successful admin login. It gives a quick snapshot of the overall system — offering real-time insights on assets, users, and locations. It helps Admins monitor activities at a glance without needing to navigate deeper into other modules.
What You’ll See on the Dashboard
Here’s a breakdown of the key widgets and visualizations:
🔢 Statistics Summary
- Locations – Total number of active locations created in the system
- No of Assets – Total count of all assets registered
- No of Assets (Last 12 months) – Assets added within the past year
- No of Users – Total admin/staff accounts created
📊 Asset by Category
A bar graph showing:
- Number of assets grouped under each category (e.g., Furniture, Office Equipment)
- Useful to understand asset distribution
🧭 Asset by Status
A circular breakdown showing:
- Total assets and their current statuses:
- 🟢 Available
- 🔧 Maintenance
- 🚫 Not Available
- 🆕 New
- 🗑 Disposed
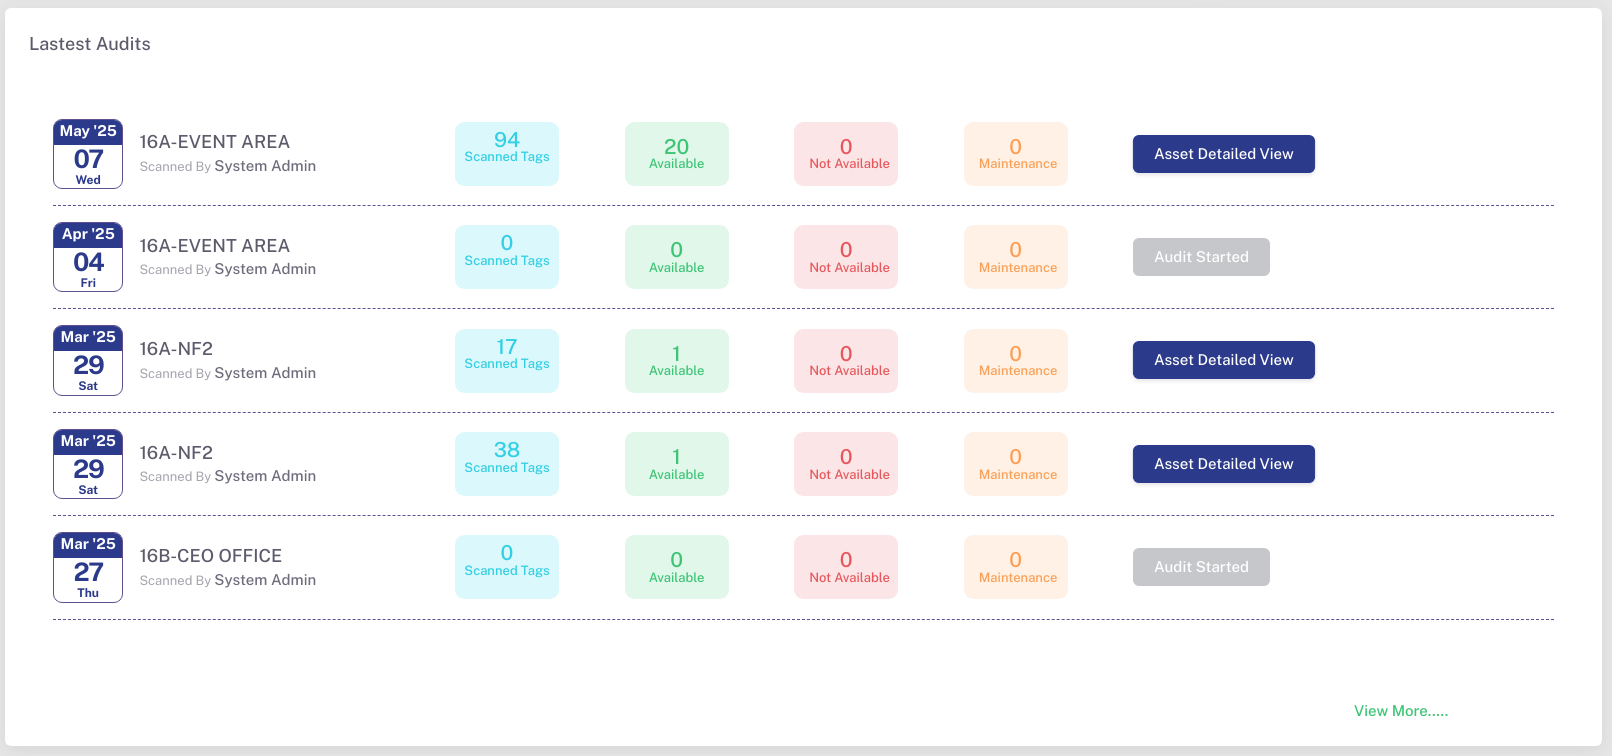
🕵️ Latest Audits
A live feed showing the most recent audits performed across different locations. Each record displays:
- 📆 Audit Date and Day
- 📌 Location Name
- 👤 Scanned By (e.g., System Admin)
- 🔍 Number of Scanned Tags
- ✅ Assets Marked Available
- ❌ Assets Not Available
- 🔧 Assets in Maintenance
- 🔘 Status: Audit Started or Asset Detailed View (depending on progress)
At the bottom, a "View More..." link provides access to the full audit report history for deeper insight.
✅ Use the dashboard daily to track changes, identify missing assets, and monitor system growth over time.